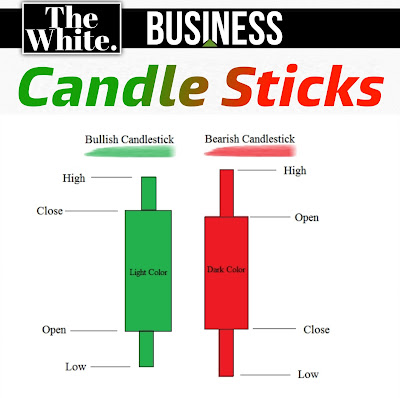
Candlestick charts were first created in Japan. This type of diagram provides a technical or extensive analysis of a market. There is a connection between demand & supply and the price of a stock, plus it is influenced by the traders.
Traders have started using candlestick charts more often than other professional analytics tools because it is easy to determine and set a price target based on past performance. Moreover, it gives extensive market details than bar charts or line charts.
Candlestick visually describes the price moves with two colors, light and dark (Green/White & Red/Black). Candlestick shows four price points - open, close, high, low.
Types of Candlesticks:

Marubozu:
- A candlestick without upper or lower shadow is Marubozu. It means closely cropped or bald. A bullish marubozu candlestick is formed while the price starts to increase right from the beginning of the day.
- When the open equals low, and the close equals high; these indicate that the market is bullish from the beginning.
- When the open equals high, and the close equals low; these indicate a bearish market.
Long body:
- The length of the body is very important as much as the length of the shadow. This is because of the length of the body or the gap between open and close; this represents the ability of bullish trend and bearish trend to influence the price during that period of time.
- A long body in a bullish candlestick indicates that the bulls were in control during that period of time and the market gave good returns; while a bullish marubozu candlestick a complete control of bullish. Just like that, a long bearish candlestick indicates a bear in control.
Doji:
- Doji designs are formed when the trading ends at the opening price. There will be no candle-body because open equals close. This indicates indecisiveness in the market.
- As this design does not indicate a bullish or bearish trend in the market, it is known as a neutral pattern.
- However, doji's indication is very important depending on the time they are created. It is considered as bearish if created after a 'light-colored' candle because it indicates that bulls are getting exhausted. If doji was created after a 'dark-colored' candlestick, that indicates bears are getting exhausted and considered as a bullish trend.
Source: The Economic Times
 |
| Click me to access the full course |
